While soaring energy prices and rising environmental concerns have prompted initiatives to raise energy-use efficiency, most such initiatives focus on the consumption side, ignoring the use of energy as intermediate inputwhich could be many times larger. The input-output information that accompanies the World Industry Service's sector performance forecasts could serve to formulate initiatives targeted at the most promising sectors.
The recent surge in energy prices, coupled with mounting environmental concerns, has dramatically spurred global interest in raising energy-use efficiencies. While initiatives to improve these efficiencies often focus on consumer activities such as home heating and vehicle fuel use, a greater potential may actually exist in the less visible and indirect uses of energy, namely as inputs in the production processes of the entire economic sector.
For instance, the total energy supply in the United States during 2005 is estimated at $982 billion (total output of energy mining and petroleum refineries), accounted for by domestic production of $691 billion and imports of $291 billion. A modest $26 billion (2.7% of total supply) of this is exported, while private and public consumption as final goods amounts to $109 billion (11.4% of total), with the balance $848 billion (88.6% of total) used as intermediate inputs by all production sectors of the economy. It is important to note, though, that in generating $691 billion worth of energy output, the energy sector itself used $495 billion worth of energy inputs, resulting in a value-added contribution of only $196 billion (28.4% of total). Thus, energy use as an intermediate input is nearly eight times as large as its use in final consumption, which suggests that the contribution to energy saving from efficiency gains in production activities would likely far outweigh any gains realizable from such gains on the consumption side.
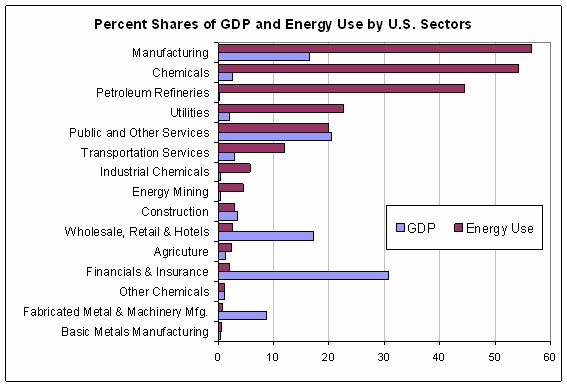
Moreover, because sectors contribute in different ways to economic activity, their energy-use intensities also differ. For instance, manufacturing, which in aggregate contributes only 16.5% of GDP (based on inflation-adjusted U.S. dollar estimates), consumes 56.6% of the total energy used as input. Most of this is accounted for by chemical manufacturing, especially petroleum refineries that convert raw energy material to refined products. Utilities, transportation services, and public services are the other major energy users, with their contribution to GDP in line with, or below, their respective energy-use shares. In contrast, financial services, wholesale and retail sales, and fabricated metal manufacturing stand out as low-intensity energy users, with their shares in GDP far exceeding their shares in energy use.
Three factors—namely, the sector's relative size, its input-output ratio, and share of energy products in the sector’s input bundle—will determine the sector’s likely contribution from efficiency gains. The larger the sector size (sector share in total output), the bigger the likely contribution to GDP from gains in energy-use efficiency. Next, the larger the share of inputs, the smaller the relative contribution to GDP (value-added component of production). On the other hand, the larger the share of inputs, the greater the potential for gains from improving input-use efficiency. Finally, the larger the share of energy in the overall input bundle, the bigger the gains from raising energy efficiency specifically.
The World Industry Service's forecast system includes the means to generate detailed input-output information consistent with our output forecasts, by sector and by country. Such detailed input-use forecast enables users to trace the role of efficiency gains within the full network of integrated production processes among all sectors and sub-sectors, and thereby helps assess the potential gains by sector in order to formulate targeted efficiency improvement measures.
For instance, in comparing the input-output information for three select countries—the United States, Germany, and Brazil—all service sectors, except transportation, rank high in terms of both contribution to output and input-output ratio. However, energy-use intensity is low, except in the transportation sector. Energy-intensive sectors are energy-mining, chemical industries, and utilities, where efficiency gains will contribute substantially to industry profits, even though their overall contribution to the economy may be small in view of their modest shares in total output.
|
Sector Shares, I/O Ratio, and Energy-Use Intensity |
|
Source: Global Insight's World Industry Service |
|
|
United States |
|
Germany |
|
Brazil |
|
|
Share in Total Outputa |
I/O Ratiob |
Energy Intensity Ratioc |
|
Share in Total Output |
I/O Ratio |
Energy Intensity Ratio |
|
Share in Total Output |
I/O Ratio |
Energy Intensity Ratio |
|
|
|
|
|
|
|
|
|
|
|
|
|
|
Agriculture |
1.7 |
59.5 |
3.0 |
|
1.4 |
53.1 |
4.1 |
|
8.5 |
46.8 |
0.4 |
|
Energy Mining |
0.5 |
49.5 |
21.9 |
|
0.3 |
67.8 |
13.2 |
|
1.1 |
26.8 |
17.5 |
|
Manufacturing |
24.8 |
63.3 |
4.5 |
|
35.3 |
65.8 |
3.4 |
|
33.4 |
25.8 |
7.5 |
|
Chemicals |
4.2 |
68.1 |
23.7 |
|
5.6 |
63.7 |
18.4 |
|
4.3 |
44.4 |
31.4 |
|
Industrial Chemicals |
0.9 |
71.2 |
11.5 |
|
1.5 |
64.9 |
8.7 |
|
1.3 |
40.8 |
4.2 |
|
Petroleum Refineries |
0.9 |
89.4 |
72.5 |
|
0.7 |
86.6 |
90.3 |
|
1.0 |
75.9 |
73.7 |
|
Other Chemicals |
1.5 |
57.7 |
1.6 |
|
1.9 |
58.9 |
1.2 |
|
1.4 |
23.0 |
1.8 |
|
Basic Metals Manufacturing |
0.8 |
68.8 |
1.5 |
|
1.6 |
70.5 |
2.7 |
|
0.9 |
56.0 |
2.7 |
|
Fabricated Metal & Machinery Mfg. |
12.3 |
62.3 |
0.1 |
|
19.4 |
65.8 |
0.3 |
|
6.7 |
44.1 |
0.5 |
|
Utilities |
1.7 |
36.1 |
45.6 |
|
2.0 |
49.0 |
21.5 |
|
2.7 |
50.8 |
33.4 |
|
Construction |
4.1 |
53.4 |
1.7 |
|
4.2 |
55.5 |
0.9 |
|
7.3 |
47.7 |
1.0 |
|
Wholesale, Retail & Hotels |
14.7 |
36.9 |
0.6 |
|
10.1 |
39.8 |
1.2 |
|
6.6 |
50.0 |
1.3 |
|
Transportation Services |
3.1 |
49.2 |
9.8 |
|
4.4 |
57.0 |
7.1 |
|
3.3 |
55.5 |
12.7 |
|
Financials & Insurance |
26.8 |
38.4 |
0.2 |
|
23.4 |
31.2 |
0.3 |
|
14.1 |
21.2 |
0.5 |
|
Public and Other Services |
18.8 |
41.3 |
3.2 |
|
15.4 |
29.6 |
1.3 |
|
19.2 |
36.2 |
1.3 |
|
|
|
|
|
|
|
|
|
|
|
|
|
|
Goods |
27.3 |
62.2 |
4.7 |
|
37.1 |
65.0 |
3.5 |
|
43.5 |
29.5 |
5.5 |
|
Services |
66.8 |
37.4 |
1.8 |
|
56.7 |
32.4 |
1.6 |
|
46.4 |
32.5 |
2.5 |
|
Total |
100.0 |
44.8 |
2.8 |
|
100.0 |
45.8 |
2.5 |
|
100.0 |
32.8 |
3.3 |
|
a. 2005 output, real (1997) dollar basis. |
|
|
|
|
|
|
|
|
|
|
|
b. Ratio of sector input use to output, real dollar basis. |
|
|
|
|
|
|
|
|
|
c. Ratio of energy use to total input use. |
|
|
|
|
|
|
|
|
|
|
Furthermore, the input-output forecast also allows one to compare relative energy-use efficiency for a particular sector across countries and regions. For instance, public services in the United States are significantly more input and energy intensive than those in Germany or Brazil. Germany is relatively more energy efficient in all of the sectors, while the services sector, particularly transportation, seems more energy-intensive in Brazil. While utilities contribute similar shares to GDP in all three countries, it is significantly more energy intensive in the United States. Agriculture is more energy intensive in the United States and Germany than in Brazil, which has low-input and less mechanized cultivation practices. Observations of such disparate performances of similar sectors across different countries can also help in focusing on potential areas for effective energy efficiency initiatives.
Raul Dary
24 Hartwell Ave.
Lexington, MA 02421, USA
Tel: 781.301.9314
Cel: 857.222.0556
Fax: 781.301.9416
raul.dary@globalinsight.com
www.globalinsight.com and www.wmrc.com